Image of the Week Gallery
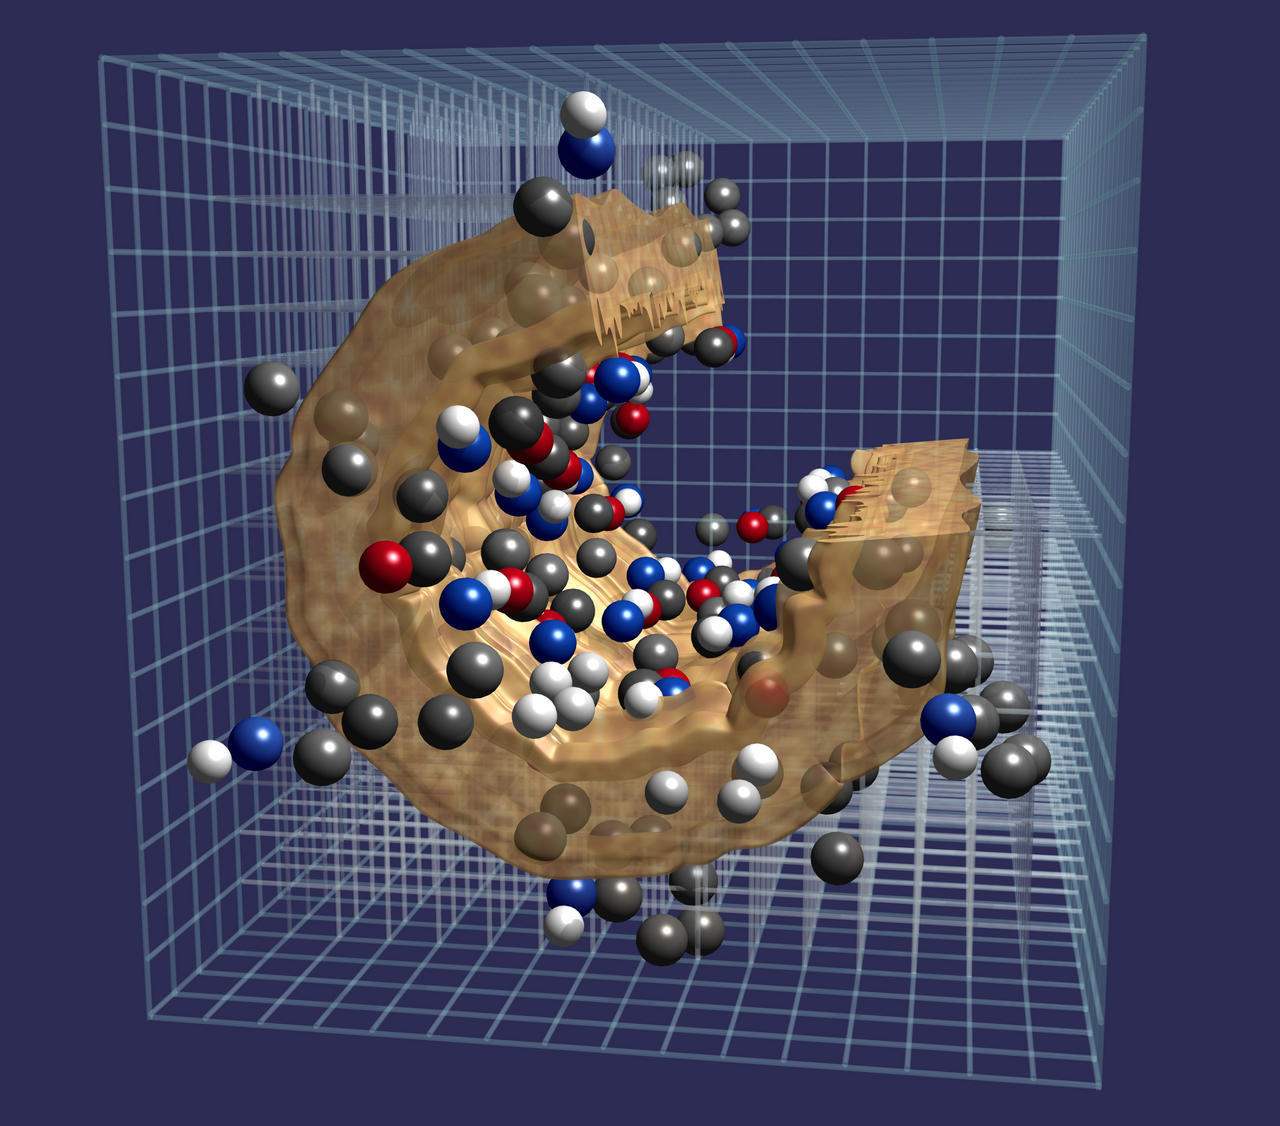
Visualization of Ions in a Calcium Channel
Media Details
Created 11/11/1999
A Perl script was written that took the ion placement date (XYZ coordinates) and converted it to a MEL script for Maya. Each different ion charge group was converted separately and Van der Waal values were used to size the ion spheres. The resulting 3D model was transferred to Softimage 3D. In Softimage, the ion charge groups were colored according to standard elemental visualization colors (Oxygen=Red, Hydrogen=White, etc. ). The calcium channel was created by taking an AVS rendering done by the researchers (again, based on original data) into Softimage and using its cut-away edges as a basis for tracing a new profile curve. This curve was then extruded 270 degrees on a circle. Textures were placed on the channel and transparency was applied to show that the ions primarily clump within the channel's walls. The ion charges and channel were placed in proper relation to each other. The grid was created from a series of cylinders and represent the fact that the data was acquired by sampling data at a series of discrete points.
Credits
- Benjamin Grosser , ITG, Beckman Institute
- J. Hanlon , ITG, Beckman Institute
- Munoj Gupta , CE Group, Beckman Institute
- Karl Hess, et al. , CE Group, Beckman Institute