Image Gallery
Gallery
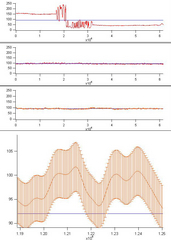
Graphic Depiction of Confocal Line Scan Data
Media Details
Created 10/27/2003 6:00:00 AM
Image depicts a 2D plot of mean intensity for x vs. time scan conducted on the Leica SP-2. Time points were collected at 500 microsecond intervals. The bottom plot depicts a portion of the previous plot magnified 10 times in the y axis and 100 times in the x axis. Error bars represent the standard deviation due to photomultiplier noise.
Credits
- Karl Garsha , ITG, Beckman Institute
- Andrea Montalvetti , Department of Veterinary Medicine
Imaging Technology Group
405 North Mathews Avenue, Urbana, IL 61801 USA
(217) 300-0566